August 1, 2025
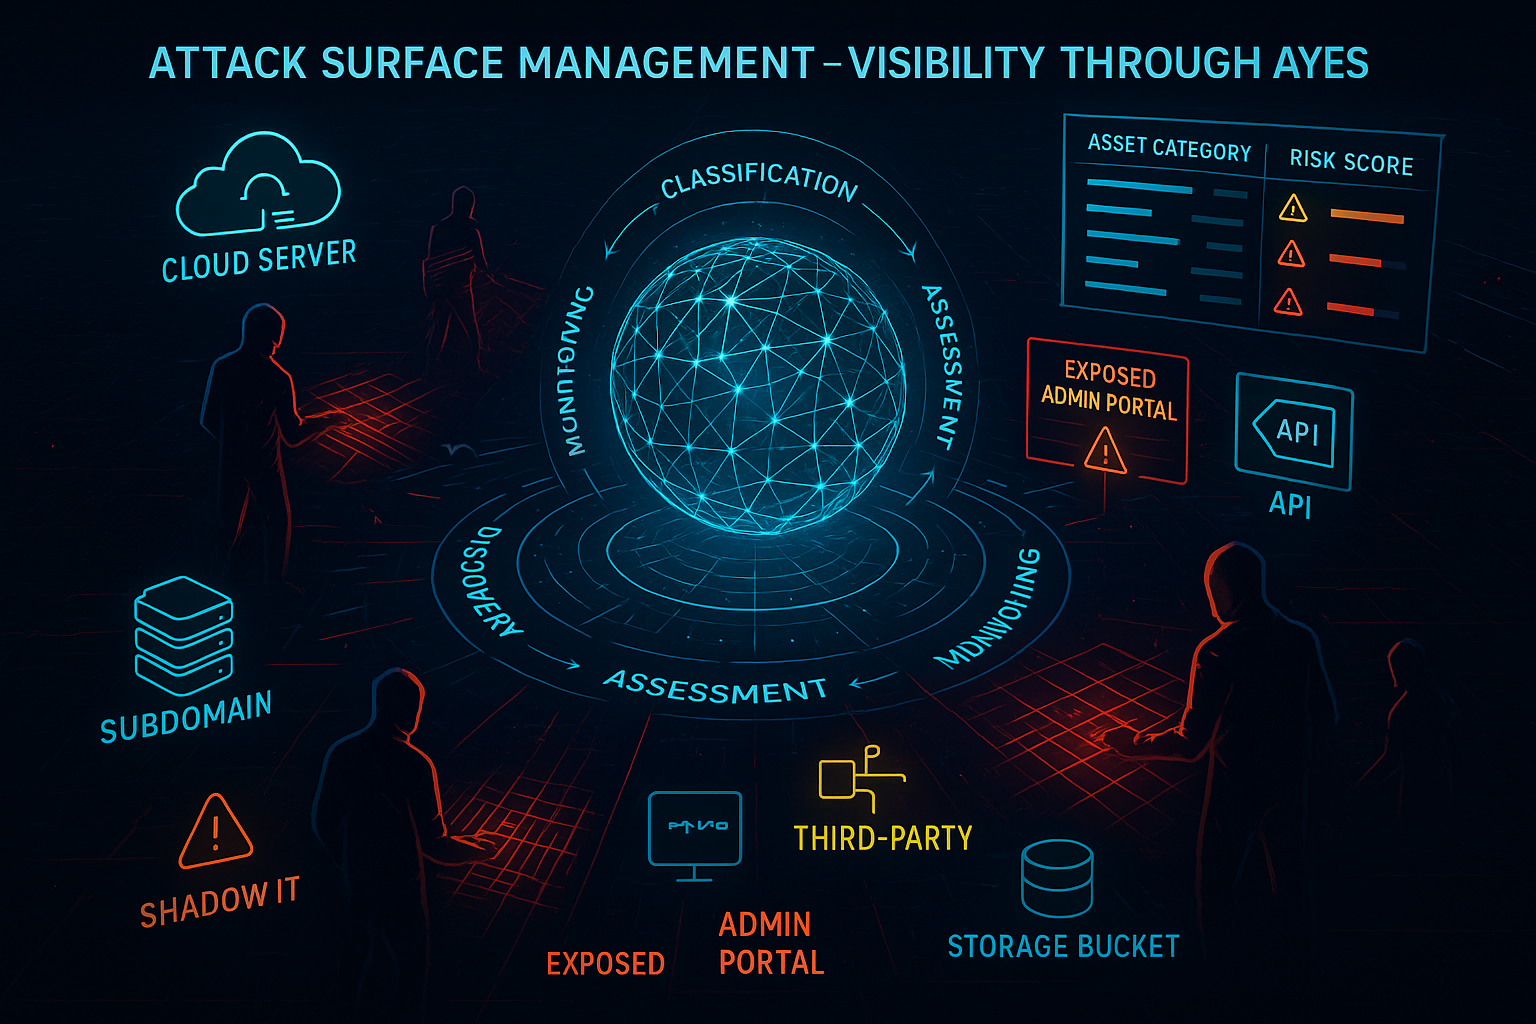
Attack Surface Management: Continuous Monitoring and Change Detection
ASM Continuous Monitoring & Change Detection: Expert Security Automation Guide
Introduction to Continuous Monitoring
Attack Surface Management is not a one-time assessment but an ongoing process of monitoring your organization’s external footprint for changes, new assets, and emerging threats. According to NIST SP 800-137, continuous monitoring provides ongoing awareness of information security, vulnerabilities, and threats to support organizational risk management decisions. Modern digital infrastructure changes rapidly - new services deploy hourly, configurations update continuously, and threat landscapes evolve daily.
Effective continuous monitoring combines automated discovery with intelligent change detection, threat intelligence correlation, and real-time alerting. Research by Ponemon Institute shows that organizations with continuous monitoring programs reduce incident response time by an average of 277 days. The goal is to identify security-relevant changes to your attack surface before attackers discover and exploit them.
Series Navigation:
- Part 1: ASM Fundamentals - Core concepts and business case for Attack Surface Management
- Part 2: Asset Discovery Methodologies - Comprehensive asset discovery techniques and tools
- Part 3: Asset Classification & Risk Assessment - Risk-based prioritization and asset classification frameworks
- Part 4: Continuous Monitoring & Change Detection ← You are here
Change Detection Fundamentals
Types of Changes to Monitor
Understanding what changes to monitor is crucial for effective Attack Surface Management. Not all changes carry equal risk, and organizations must prioritize their monitoring efforts based on business impact and security implications.
New Asset Discovery
- New subdomains and DNS records
- Additional IP addresses and services
- Cloud service deployments
- Third-party integrations
New asset discovery represents one of the highest priority monitoring activities. Organizations deploy new services continuously, often without proper security review. Subdomains frequently appear as developers create test environments or deploy microservices. Cloud services can be provisioned instantly, bypassing traditional change management processes. The speed of modern development cycles means that new assets can appear and disappear within hours, making continuous monitoring essential.
Service Modifications
- Port and service changes
- Application updates and versions
- Configuration modifications
- SSL certificate updates
Service modifications often indicate significant changes to application functionality or security posture. Port changes might reveal new services or changed architectures. Application updates can introduce new vulnerabilities or change attack surfaces. Configuration modifications may weaken security controls or expose new functionality. SSL certificate updates, while often routine, can indicate infrastructure changes or certificate management issues.
Security Control Changes
- Authentication mechanism updates
- Access control modifications
- Security header implementations
- Firewall and filtering changes
Security control changes directly impact an organization’s risk posture following NIST Risk Management Framework. Authentication mechanism updates might strengthen security per NIST SP 800-63B but could also introduce new vulnerabilities documented in OWASP Authentication Cheat Sheet. Access control modifications can expose previously protected resources against NIST SP 800-53 AC controls. Security header implementations indicate evolving security practices following OWASP Secure Headers Project, while firewall changes might reveal new services or changed protection strategies per NIST SP 800-41.
Infrastructure Changes
- Cloud resource deployment
- Network architecture updates
- CDN and load balancer changes
- DNS delegation modifications
Infrastructure changes represent fundamental shifts in how organizations deliver services following TOGAF Architecture Framework. Cloud resource deployments can happen rapidly using Infrastructure as Code and often bypass traditional approval processes per COBIT Change Management. Network architecture updates might expose new attack vectors documented in NIST SP 800-207 or change existing ones analyzed in Zero Trust Architecture. CDN and load balancer changes can affect how traffic flows and where security controls are implemented according to Cloud Security Alliance Guidelines.
Monitoring Frequency Considerations
The frequency of monitoring must balance comprehensive coverage with resource constraints and operational requirements. Different asset types require different monitoring approaches based on their risk profile and change frequency.
Real-time Monitoring (Continuous) Critical assets requiring immediate change detection:
- Customer-facing applications
- Administrative interfaces
- Payment processing systems
- High-value data repositories
Real-time monitoring is reserved for the most critical assets where immediate detection of changes is essential following NIST SP 800-92. Customer-facing applications require continuous monitoring because changes can immediately impact user experience and security posture per SRE Best Practices. Administrative interfaces need constant surveillance because unauthorized changes could indicate compromise according to MITRE ATT&CK T1505. Payment processing systems require immediate detection due to PCI DSS Requirement 10 and fraud prevention needs.
High-frequency Monitoring (Hourly) Important assets needing rapid detection:
- API endpoints
- Business-critical applications
- Compliance-scoped systems
- Partner integration points
Hourly monitoring balances comprehensive coverage with resource efficiency. API endpoints change frequently as applications evolve, requiring regular monitoring to detect new functionality or security issues. Business-critical applications need timely detection of changes that might impact operations. Compliance-scoped systems require frequent monitoring to ensure ongoing regulatory compliance.
Regular Monitoring (Daily) Standard monitoring for most assets:
- Corporate websites
- Marketing platforms
- Development environments
- Documentation sites
Daily monitoring provides adequate coverage for most organizational assets. Corporate websites and marketing platforms change regularly but rarely require immediate detection per Web Content Management. Development environments need monitoring to ensure they don’t accidentally expose sensitive information according to OWASP Code Review Guide. Documentation sites require monitoring to detect unauthorized changes or information disclosure per Information Classification Standards.
Periodic Monitoring (Weekly/Monthly) Lower-priority assets and comprehensive sweeps:
- Legacy systems
- Archived content
- Third-party dependencies
- Complete infrastructure audits
Periodic monitoring covers assets that change infrequently or represent lower risk. Legacy systems might not change often, but monitoring ensures they remain secure. Archived content requires periodic checks to ensure it doesn’t become a security liability. Third-party dependencies need regular monitoring to detect changes in external services. Complete infrastructure audits provide comprehensive coverage to identify missed assets or changes.
DNS and Certificate Monitoring
DNS and certificate monitoring form the backbone of external attack surface monitoring. According to RFC 1034, the Domain Name System provides a hierarchical namespace for internet resources, making DNS monitoring critical for attack surface visibility. These systems provide authoritative information about organizational assets and their security configurations, making them essential components of any comprehensive monitoring strategy.
DNS Change Detection
DNS changes often indicate significant infrastructure modifications. The Certificate Transparency (CT) ecosystem provides additional visibility into SSL certificate changes that complement DNS monitoring. Organizations modify DNS records when deploying new services, changing hosting providers, or updating security configurations. Monitoring these changes provides early warning of potential security implications.
DNS Record Monitoring Track changes to critical DNS records:
#!/bin/bash
# DNS monitoring script
DOMAIN=$1
RECORD_TYPES="A AAAA CNAME MX NS TXT"
BASELINE_FILE="/var/lib/asm/dns_baseline_${DOMAIN}.txt"
CURRENT_FILE="/tmp/dns_current_${DOMAIN}.txt"

for record_type in $RECORD_TYPES; do
    echo "# $record_type records for $DOMAIN" >> $CURRENT_FILE
    dig +short $DOMAIN $record_type >> $CURRENT_FILE
    echo "" >> $CURRENT_FILE
done

# Compare with baseline
if [ -f "$BASELINE_FILE" ]; then
    if ! diff -u "$BASELINE_FILE" "$CURRENT_FILE" > /dev/null; then
        echo "DNS changes detected for $DOMAIN"
        diff -u "$BASELINE_FILE" "$CURRENT_FILE"
        # Send alert
        send_alert "DNS changes" "$DOMAIN" "$(diff -u $BASELINE_FILE $CURRENT_FILE)"
    fi
fi

# Update baseline
cp "$CURRENT_FILE" "$BASELINE_FILE"
This script demonstrates a systematic approach to DNS change detection. Each record type provides different intelligence - A records reveal hosting changes, MX records indicate email infrastructure modifications, and TXT records often contain security-related information like SPF records. The baseline comparison approach ensures that only meaningful changes trigger alerts, reducing false positives while maintaining comprehensive coverage.
Subdomain Monitoring Continuously discover new subdomains:
# Certificate transparency monitoring
monitor_ct_logs() {
    local domain=$1
    local last_id_file="/var/lib/asm/ct_last_id_${domain}.txt"

    # Get current certificates
    curl -s "https://crt.sh/?q=%.${domain}&output=json" | \
        jq -r '.[].id' | sort -n > /tmp/ct_current_${domain}.txt

    if [ -f "$last_id_file" ]; then
        # Find new certificates
        comm -13 "$last_id_file" "/tmp/ct_current_${domain}.txt" > /tmp/ct_new_${domain}.txt

        if [ -s "/tmp/ct_new_${domain}.txt" ]; then
            echo "New certificates found for $domain"
            # Process new certificates
            while read cert_id; do
                cert_info=$(curl -s "https://crt.sh/?id=${cert_id}&output=json")
                echo "New certificate: $cert_info"
                # Send alert for new certificate
                send_certificate_alert "$domain" "$cert_info"
            done < /tmp/ct_new_${domain}.txt
        fi
    fi

    # Update tracking file
    cp "/tmp/ct_current_${domain}.txt" "$last_id_file"
}
Certificate transparency monitoring provides one of the most reliable methods for discovering new subdomains. Unlike traditional DNS enumeration, CT logs capture every certificate issued by trusted Certificate Authorities, providing comprehensive visibility into SSL/TLS deployments. This approach is particularly valuable for detecting internal applications that developers accidentally expose or development environments that shouldn’t be publicly accessible.
SSL Certificate Monitoring
SSL certificate monitoring encompasses more than just expiration tracking following RFC 5280 X.509 certificate standards. Comprehensive certificate monitoring provides intelligence about infrastructure changes, security practices, and potential security issues using tools like SSL Labs.
Certificate Transparency Log Monitoring Monitor CT logs for new certificates issued for your domains using crt.sh API and Censys:
Certificate Expiration Tracking Monitor certificate lifecycles:
# Certificate expiration monitoring
check_certificate_expiration() {
    local hostname=$1
    local warning_days=30

    # Get certificate expiration date
    expiry_date=$(echo | openssl s_client -connect "${hostname}:443" -servername "$hostname" 2>/dev/null | \
        openssl x509 -noout -enddate 2>/dev/null | cut -d= -f2)

    if [ -n "$expiry_date" ]; then
        expiry_epoch=$(date -d "$expiry_date" +%s)
        current_epoch=$(date +%s)
        days_until_expiry=$(( (expiry_epoch - current_epoch) / 86400 ))

        if [ $days_until_expiry -lt $warning_days ]; then
            echo "Certificate expiring soon: $hostname ($days_until_expiry days)"
            send_alert "certificate_expiration" "$hostname" "Expires in $days_until_expiry days"
        fi
    fi
}
Certificate expiration monitoring prevents service disruptions and maintains security posture. Expired certificates not only cause user-facing errors but also indicate potential gaps in certificate management processes. The 30-day warning period provides adequate time for certificate renewal while ensuring that expiring certificates don’t cause unexpected service interruptions.
Certificate Authority and Chain Monitoring Track changes in certificate issuers and chains:
# Certificate chain analysis
analyze_certificate_chain() {
    local hostname=$1

    # Get full certificate chain
    echo | openssl s_client -connect "${hostname}:443" -showcerts 2>/dev/null | \
        awk '/BEGIN CERTIFICATE/,/END CERTIFICATE/' | \
        split -p "-----BEGIN CERTIFICATE-----" - /tmp/cert_

    # Analyze each certificate in chain
    for cert_file in /tmp/cert_*; do
        if [ -s "$cert_file" ]; then
            issuer=$(openssl x509 -in "$cert_file" -noout -issuer 2>/dev/null)
            subject=$(openssl x509 -in "$cert_file" -noout -subject 2>/dev/null)
            echo "Certificate: $subject"
            echo "Issued by: $issuer"
        fi
    done

    # Clean up
    rm -f /tmp/cert_*
}
Certificate chain analysis reveals important information about organizational security practices and potential trust issues. Changes in Certificate Authorities might indicate infrastructure changes or security policy modifications. Certificate chain analysis also helps identify potential man-in-the-middle attacks or certificate substitution attacks that might otherwise go undetected.
Service and Application Monitoring
Service and application monitoring focuses on understanding how applications behave and detecting changes that might indicate security issues or operational problems. This monitoring goes beyond simple availability checks to understand application functionality and security posture.
Port and Service Detection
Port scanning and service detection provide fundamental intelligence about what services organizations expose. However, modern applications use complex architectures that require sophisticated monitoring approaches.
Service Change Monitoring Track changes in exposed services:
# Service monitoring script
monitor_services() {
    local target=$1
    local baseline_file="/var/lib/asm/services_${target//\//_}.txt"
    local current_file="/tmp/services_current_${target//\//_}.txt"

    # Scan common ports
    nmap -sS -T4 -p 80,443,22,21,25,53,110,143,993,995,8080,8443 \
        --open "$target" | grep "^[0-9]" > "$current_file"

    # Compare with baseline
    if [ -f "$baseline_file" ]; then
        # Check for new services
        new_services=$(comm -13 "$baseline_file" "$current_file")
        if [ -n "$new_services" ]; then
            echo "New services detected on $target:"
            echo "$new_services"
            send_alert "new_services" "$target" "$new_services"
        fi

        # Check for removed services
        removed_services=$(comm -23 "$baseline_file" "$current_file")
        if [ -n "$removed_services" ]; then
            echo "Services removed from $target:"
            echo "$removed_services"
            send_alert "removed_services" "$target" "$removed_services"
        fi
    fi

    # Update baseline
    cp "$current_file" "$baseline_file"
}
Service change monitoring provides early warning of infrastructure modifications that might impact security posture. New services often indicate application deployments or architecture changes that require security review. Removed services might indicate legitimate decommissioning or potential security incidents. The baseline comparison approach ensures that only meaningful changes trigger alerts while maintaining comprehensive coverage of service landscapes.
Web Application Monitoring
Web applications represent the most dynamic components of modern attack surfaces. Applications change frequently as organizations deploy new features, update dependencies, and modify configurations.
HTTP Response Monitoring Track changes in web application responses:
# HTTP response monitoring
monitor_http_response() {
    local url=$1
    local baseline_file="/var/lib/asm/http_${url//\//_}.txt"
    local current_file="/tmp/http_current_${url//\//_}.txt"

    # Capture response headers and key content
    {
        echo "=== HEADERS ==="
        curl -I -s "$url" 2>/dev/null | head -20
        echo "=== TITLE ==="
        curl -s "$url" 2>/dev/null | grep -i "<title>" | head -1
        echo "=== SERVER INFO ==="
        curl -I -s "$url" 2>/dev/null | grep -i "server:"
        curl -I -s "$url" 2>/dev/null | grep -i "x-powered-by:"
    } > "$current_file"

    # Compare with baseline
    if [ -f "$baseline_file" ]; then
        if ! diff -u "$baseline_file" "$current_file" > /dev/null; then
            echo "HTTP response changes detected for $url"
            diff -u "$baseline_file" "$current_file"
            send_alert "http_changes" "$url" "$(diff -u $baseline_file $current_file)"
        fi
    fi

    # Update baseline
    cp "$current_file" "$baseline_file"
}
HTTP response monitoring captures application-level changes that might indicate security issues or operational problems. Server header changes might reveal infrastructure updates or security modifications. Title changes often indicate application updates or content modifications. This approach provides application-level intelligence that complements network-level monitoring.
Technology Stack Monitoring Detect changes in web technologies:
# Technology detection and monitoring
detect_technologies() {
    local url=$1
    local tech_file="/tmp/tech_${url//\//_}.txt"

    # Gather technology indicators
    {
        echo "=== HTTP HEADERS ==="
        curl -I -s "$url" | grep -iE "(server|x-powered-by|x-framework|x-version)"

        echo "=== HTML CONTENT ==="
        curl -s "$url" | grep -ioE "(wordpress|drupal|joomla|django|rails|express|spring)" | head -10

        echo "=== JAVASCRIPT FRAMEWORKS ==="
        curl -s "$url" | grep -ioE "(jquery|angular|react|vue|bootstrap)" | head -10

        echo "=== META TAGS ==="
        curl -s "$url" | grep -i "generator" | head -5
    } > "$tech_file"

    echo "Technologies detected for $url:"
    cat "$tech_file"
}
Technology stack monitoring provides intelligence about application frameworks, libraries, and infrastructure components using tools like Wappalyzer and BuiltWith. This information helps security teams understand potential vulnerabilities documented in CVE Database and attack vectors per OWASP Top 10. Changes in technology stacks might indicate application updates that require security review following Secure Code Review or introduce new vulnerabilities analyzed in NIST National Vulnerability Database.
Threat Intelligence Integration
Threat intelligence integration transforms raw monitoring data into actionable security intelligence. According to NIST SP 800-150, cyber threat intelligence enables informed decision-making by providing context about threat actor capabilities, infrastructure, and tactics. By correlating discovered assets and detected changes with current threat information, organizations can prioritize their response efforts and identify potential security issues before they become incidents.
IOC Correlation
Indicator of Compromise (IOC) correlation represents one of the most immediate applications of threat intelligence integration. The STIX/TAXII framework provides standardized formats for sharing threat intelligence that enhance IOC correlation capabilities. When new assets are discovered or existing assets change, they should be automatically checked against current threat intelligence feeds.
Automated IOC Checking Correlate discovered assets with threat intelligence:
# IOC correlation script
check_iocs() {
    local asset_list=$1
    local ioc_feed_url="https://threat-intel-feed.example.com/iocs.json"

    # Download current IOCs
    curl -s "$ioc_feed_url" | jq -r '.indicators[] | select(.type=="domain") | .value' > /tmp/malicious_domains.txt
    curl -s "$ioc_feed_url" | jq -r '.indicators[] | select(.type=="ip") | .value' > /tmp/malicious_ips.txt

    # Check assets against IOCs
    while read asset; do
        # Extract domain and IP
        domain=$(echo "$asset" | sed 's|https\?://||' | cut -d'/' -f1)
        ip=$(dig +short "$domain" | head -1)

        # Check domain against IOCs
        if grep -q "^${domain}$" /tmp/malicious_domains.txt; then
            echo "THREAT DETECTED: Domain $domain matches known IOC"
            send_critical_alert "ioc_match" "$domain" "Malicious domain detected"
        fi

        # Check IP against IOCs
        if [ -n "$ip" ] && grep -q "^${ip}$" /tmp/malicious_ips.txt; then
            echo "THREAT DETECTED: IP $ip for $domain matches known IOC"
            send_critical_alert "ioc_match" "$domain ($ip)" "Malicious IP detected"
        fi
    done < "$asset_list"
}
IOC correlation provides immediate detection of compromised or malicious infrastructure. When organizations discover new assets or detect changes to existing ones, automated IOC checking ensures that known threats are identified immediately. This approach is particularly valuable for detecting domain hijacking, DNS poisoning, or infrastructure compromise that might otherwise go unnoticed.
Vulnerability Intelligence
Vulnerability intelligence integration helps organizations understand the security implications of discovered technologies and services. By correlating discovered software versions with known vulnerabilities, security teams can prioritize their remediation efforts.
CVE Correlation Match discovered technologies with known vulnerabilities:
# CVE correlation for discovered technologies
correlate_cves() {
    local asset=$1
    local tech_info=$2

    # Extract version information
    server_info=$(echo "$tech_info" | grep -i "server:" | cut -d':' -f2 | tr -d ' ')

    if [[ "$server_info" =~ nginx/([0-9.]+) ]]; then
        version="${BASH_REMATCH[1]}"
        echo "Nginx version $version detected on $asset"

        # Check for known vulnerabilities
        check_nginx_vulns "$version" "$asset"
    elif [[ "$server_info" =~ Apache/([0-9.]+) ]]; then
        version="${BASH_REMATCH[1]}"
        echo "Apache version $version detected on $asset"

        # Check for known vulnerabilities
        check_apache_vulns "$version" "$asset"
    fi
}

check_nginx_vulns() {
    local version=$1
    local asset=$2

    # Example: Check for specific CVEs
    if [[ "$version" < "1.20.1" ]]; then
        echo "VULNERABILITY: $asset running Nginx $version vulnerable to CVE-2021-23017"
        send_alert "vulnerability" "$asset" "Nginx $version - CVE-2021-23017"
    fi
}
CVE correlation provides immediate understanding of vulnerability exposure for discovered assets. This approach helps security teams prioritize remediation efforts based on actual vulnerability exposure rather than generic risk assessments. The automated correlation ensures that newly discovered vulnerabilities are immediately checked against organizational assets.
Dark Web Monitoring
Dark web monitoring provides intelligence about potential data breaches, credential exposure, and other security incidents that might not be detected through traditional monitoring approaches.
Credential Monitoring Monitor for exposed credentials related to discovered assets:
# Dark web monitoring integration
monitor_dark_web() {
    local domain=$1
    local api_key="your_dark_web_api_key"

    # Query dark web monitoring service
    response=$(curl -s -H "Authorization: Bearer $api_key" \
        "https://dark-web-api.example.com/search?domain=$domain")

    # Parse results
    if echo "$response" | jq -e '.results | length > 0' > /dev/null; then
        echo "Dark web mentions found for $domain"
        echo "$response" | jq -r '.results[] | "Found: \(.content) - Source: \(.source)"'
        send_alert "dark_web_mention" "$domain" "Potential data exposure detected"
    fi
}
Dark web monitoring provides early warning of potential data breaches or credential exposure. When integrated with asset discovery, it helps organizations understand whether their discovered assets are involved in underground activities or have been compromised. This intelligence is particularly valuable for detecting breaches that might not be immediately apparent through traditional monitoring.
Automated Alerting and Response
Effective monitoring systems generate significant volumes of data and potential alerts. Automated alerting and response systems ensure that security teams focus on the most critical issues while maintaining comprehensive coverage of security events.
Alert Classification
Alert classification systems help organizations prioritize their response efforts based on risk, impact, and urgency. Not all changes require immediate attention, and effective classification ensures that critical issues receive appropriate focus.
Alert Severity Levels Classify alerts based on risk and urgency:
Critical Alerts (Immediate Response) Critical alerts require immediate attention and typically indicate active security threats or significant exposures that could lead to immediate compromise.
- New administrative interfaces exposed
- Known malicious IOC matches
- High-value asset compromise indicators
- Regulatory compliance violations
Critical alerts demand immediate response because they represent active threats or significant security exposures. Administrative interfaces appearing unexpectedly might indicate compromise or unauthorized deployments. IOC matches suggest active threats or compromised infrastructure. High-value asset compromise indicators require immediate investigation to prevent further damage.
High Priority (Response within 4 hours) High-priority alerts indicate significant security issues that require timely response but might not represent immediate threats.
- New services on critical assets
- Certificate transparency anomalies
- Significant configuration changes
- Vulnerability matches on exposed services
High-priority alerts require prompt attention because they might indicate security issues or operational problems that could escalate. New services on critical assets need investigation to ensure proper security controls. Certificate transparency anomalies might indicate infrastructure changes or security issues. Vulnerability matches require timely remediation to prevent exploitation.
Medium Priority (Response within 24 hours) Medium-priority alerts indicate potential security issues that require investigation but don’t represent immediate threats.
- New subdomain discoveries
- Minor service changes
- Certificate expiration warnings
- Technology stack changes
Medium-priority alerts require investigation within reasonable timeframes. New subdomain discoveries need verification to ensure they’re authorized. Minor service changes might indicate legitimate updates or potential security issues. Certificate expiration warnings provide adequate time for renewal while preventing service disruptions.
Low Priority (Response within 1 week) Low-priority alerts provide information that might be useful for security awareness but don’t require immediate action.
- Documentation updates
- Non-critical asset changes
- Information gathering alerts
- Routine monitoring notifications
Low-priority alerts provide situational awareness without requiring immediate response. Documentation updates might indicate legitimate changes or information disclosure. Non-critical asset changes provide context for understanding organizational activities. Information gathering alerts help maintain comprehensive awareness of organizational activities.
Alert Delivery Mechanisms
Effective alert delivery ensures that security teams receive timely notification of important events while avoiding alert fatigue from excessive notifications.
Real-time Notifications
# Slack integration for real-time alerts
send_slack_alert() {
    local severity=$1
    local asset=$2
    local message=$3
    local webhook_url="https://hooks.slack.com/services/YOUR/SLACK/WEBHOOK"

    # Choose emoji and color based on severity
    case $severity in
        "critical") emoji="🚨"; color="danger" ;;
        "high") emoji="⚠️"; color="warning" ;;
        "medium") emoji="📍"; color="good" ;;
        "low") emoji="ℹ️"; color="#36a64f" ;;
    esac

    # Send Slack notification
    curl -X POST -H 'Content-type: application/json' \
        --data "{
            \"attachments\": [{
                \"color\": \"$color\",
                \"title\": \"${emoji} ASM Alert - ${severity^^}\",
                \"fields\": [
                    {\"title\": \"Asset\", \"value\": \"$asset\", \"short\": true},
                    {\"title\": \"Details\", \"value\": \"$message\", \"short\": false}
                ],
                \"footer\": \"ASM Monitoring System\",
                \"ts\": $(date +%s)
            }]
        }" "$webhook_url"
}
Real-time notifications ensure that security teams receive immediate awareness of critical events. Slack integration provides immediate visibility within existing communication workflows. The severity-based formatting helps teams quickly understand the urgency of each alert and prioritize their response efforts accordingly.
Email Notifications
# Email alerting for detailed reports
send_email_alert() {
    local subject=$1
    local body=$2
    local recipients="security-team@example.com"

    # Send email using sendmail or SMTP
    {
        echo "To: $recipients"
        echo "Subject: [ASM Alert] $subject"
        echo "Content-Type: text/html"
        echo ""
        echo "<h2>ASM Monitoring Alert</h2>"
        echo "<p><strong>Alert Time:</strong> $(date)</p>"
        echo "<pre>$body</pre>"
        echo "<p>--<br>ASM Monitoring System</p>"
    } | sendmail "$recipients"
}
Email notifications provide detailed information and permanent records of security events. This approach is particularly valuable for complex alerts that require detailed investigation or for maintaining audit trails of security events. The HTML formatting improves readability while ensuring that detailed technical information is preserved.
Automated Response Actions
Automated response actions help organizations react quickly to security events while reducing the burden on security teams. However, automation must be carefully designed to avoid disrupting legitimate business activities.
Immediate Response Automation
# Automated response for critical findings
automated_response() {
    local alert_type=$1
    local asset=$2
    local details=$3

    case $alert_type in
        "malicious_ioc")
            # Block asset at firewall level
            block_asset_firewall "$asset"
            # Create incident ticket
            create_incident_ticket "Critical" "Malicious IOC detected" "$asset: $details"
            # Notify SOC immediately
            notify_soc_urgent "$asset" "$details"
            ;;
        "admin_exposure")
            # Notify asset owner immediately
            notify_asset_owner "$asset" "Administrative interface exposed"
            # Create high-priority ticket
            create_incident_ticket "High" "Admin interface exposure" "$asset: $details"
            # Schedule emergency security scan
            schedule_security_scan "$asset" "emergency"
            ;;
        "new_critical_service")
            # Perform immediate security assessment
            quick_security_scan "$asset"
            # Notify security team
            send_slack_alert "high" "$asset" "New critical service detected: $details"
            ;;
    esac
}
Automated response actions provide immediate mitigation for the most critical security events. IOC matches might trigger immediate blocking to prevent further compromise. Administrative interface exposure requires immediate notification and assessment. New critical services need immediate security evaluation to ensure proper controls are in place.
Monitoring Infrastructure and Architecture
Effective monitoring requires robust infrastructure that can handle the scale and complexity of modern organizational assets. The architecture must support continuous monitoring while providing reliable alerting and response capabilities.
Distributed Monitoring Architecture
Modern monitoring architectures must account for geographic distribution, redundancy, and scalability requirements. Single-point monitoring approaches cannot provide the comprehensive coverage required for effective Attack Surface Management.
Multi-Location Monitoring Deploy monitoring from multiple geographic locations:
Geographic distribution provides multiple perspectives on organizational assets and helps identify regional issues or targeted attacks. Internal monitoring provides understanding of how assets appear from corporate networks, while external monitoring reveals how they appear to potential attackers.
- Internal Monitoring: From corporate networks
- External Monitoring: From cloud providers
- CDN Monitoring: From edge locations
- Mobile Monitoring: From cellular networks
Multi-location monitoring provides comprehensive coverage and helps identify issues that might only be visible from specific network locations. Internal monitoring reveals how assets appear to employees, while external monitoring shows the attacker’s perspective. CDN monitoring helps understand content delivery performance and security, while mobile monitoring ensures that assets are accessible from cellular networks.
Monitoring Infrastructure Components
# Docker Compose for ASM monitoring stack
version: '3.8'
services:
  asm-monitor:
    image: asm-monitor:latest
    environment:
      - TARGETS_FILE=/config/targets.txt
      - ALERT_WEBHOOK=https://hooks.slack.com/services/YOUR/WEBHOOK
      - CHECK_INTERVAL=3600
    volumes:
      - ./config:/config
      - ./data:/data
    restart: unless-stopped

  certificate-monitor:
    image: cert-monitor:latest
    environment:
      - DOMAINS_FILE=/config/domains.txt
      - CT_LOGS_ENDPOINT=https://crt.sh/
      - ALERT_DAYS=30
    volumes:
      - ./config:/config
      - ./data:/data
    restart: unless-stopped

  threat-intel:
    image: threat-intel:latest
    environment:
      - IOC_FEEDS=/config/ioc_feeds.json
      - CORRELATION_INTERVAL=1800
    volumes:
      - ./config:/config
      - ./data:/data
    restart: unless-stopped
Containerized monitoring infrastructure provides scalability, reliability, and easy deployment. Each component focuses on specific monitoring tasks while sharing configuration and data through mounted volumes. This approach allows for independent scaling and maintenance of different monitoring functions.
Scalability Considerations
Monitoring systems must scale to handle growing numbers of assets and increasing monitoring frequency. Effective scaling requires careful consideration of resource utilization, data storage, and processing capabilities.
High-Volume Monitoring Handle large-scale monitoring requirements:
Large-scale monitoring requires distributed architectures that can handle thousands of assets while maintaining reasonable response times. Load balancing and parallel processing become essential for managing monitoring workloads effectively.
Load Distribution
- Distribute monitoring across multiple systems
- Use queue systems for processing large datasets
- Implement rate limiting to avoid overwhelming targets
- Cache results to reduce redundant checks
Load distribution ensures that monitoring systems remain responsive even when handling large numbers of assets. Queue systems help manage processing workloads and prevent system overload. Rate limiting demonstrates responsible monitoring practices while maintaining comprehensive coverage.
Data Storage and Retention
-- Database schema for monitoring data
CREATE TABLE monitoring_results (
    id SERIAL PRIMARY KEY,
    asset_url VARCHAR(255) NOT NULL,
    check_type VARCHAR(50) NOT NULL,
    result_data JSONB,
    baseline_data JSONB,
    change_detected BOOLEAN DEFAULT FALSE,
    risk_score INTEGER,
    timestamp TIMESTAMP DEFAULT CURRENT_TIMESTAMP,
    INDEX(asset_url, check_type),
    INDEX(timestamp),
    INDEX(change_detected, risk_score)
);

-- Automated cleanup of old data
DELETE FROM monitoring_results
WHERE timestamp < NOW() - INTERVAL '90 days'
AND change_detected = FALSE;
Database design for monitoring data must balance query performance with storage efficiency. Indexing strategies should support common query patterns while minimizing storage overhead. Automated cleanup policies prevent database growth from impacting system performance while preserving important historical data.
Performance Optimization
As monitoring systems mature and scale, performance optimization becomes crucial for maintaining effectiveness without overwhelming resources. Organizations must balance comprehensive coverage with system efficiency to ensure sustainable operations.
Monitoring Efficiency
Effective monitoring requires intelligent resource allocation and optimization strategies. Without proper optimization, monitoring systems can become resource-intensive and impact the very systems they’re designed to protect.
Intelligent Scheduling Optimize monitoring frequency based on asset characteristics:
# Dynamic scheduling based on asset risk
schedule_monitoring() {
    local asset=$1
    local risk_score=$2
    local asset_type=$3

    # Calculate monitoring frequency
    if [ $risk_score -ge 8 ]; then
        frequency="hourly"
    elif [ $risk_score -ge 6 ]; then
        frequency="4hourly"
    elif [ $risk_score -ge 4 ]; then
        frequency="daily"
    else
        frequency="weekly"
    fi

    # Special handling for asset types
    case $asset_type in
        "admin_interface") frequency="hourly" ;;
        "api_endpoint") frequency="4hourly" ;;
        "development") frequency="daily" ;;
    esac

    echo "Scheduling $asset for $frequency monitoring"
    add_to_monitoring_queue "$asset" "$frequency"
}
Intelligent scheduling optimizes resource utilization by adjusting monitoring frequency based on risk and asset characteristics. High-risk assets require more frequent monitoring, while lower-risk assets can be monitored less frequently. This approach ensures that monitoring resources are allocated where they provide the greatest security value.
Caching and Optimization Reduce redundant monitoring activities:
# Caching system for monitoring results
cache_result() {
    local asset=$1
    local check_type=$2
    local result=$3
    local cache_duration=$4

    cache_key="${asset}_${check_type}"
    cache_file="/var/cache/asm/${cache_key}.cache"

    # Store result with timestamp
    echo "$(date +%s):$result" > "$cache_file"

    # Set cache expiration
    find "/var/cache/asm" -name "${cache_key}.cache" -mmin +$cache_duration -delete
}

get_cached_result() {
    local asset=$1
    local check_type=$2
    local max_age=$3

    cache_key="${asset}_${check_type}"
    cache_file="/var/cache/asm/${cache_key}.cache"

    if [ -f "$cache_file" ]; then
        cache_time=$(cut -d':' -f1 "$cache_file")
        cache_data=$(cut -d':' -f2- "$cache_file")
        current_time=$(date +%s)

        if [ $((current_time - cache_time)) -lt $((max_age * 60)) ]; then
            echo "$cache_data"
            return 0
        fi
    fi

    return 1
}
Caching systems reduce redundant monitoring activities by storing recent results and avoiding duplicate checks. This approach significantly reduces monitoring overhead while maintaining comprehensive coverage. The cache expiration system ensures that cached results remain current without sacrificing monitoring effectiveness.
Key Takeaways
- Continuous Process: ASM monitoring must be ongoing, not periodic assessments
- Intelligent Alerting: Classify and prioritize alerts based on risk and business impact
- Automation Essential: Manual monitoring doesn’t scale for modern infrastructure
- Threat Intelligence: Integrate external intelligence for comprehensive threat detection
- Response Integration: Connect monitoring with incident response and remediation workflows